Environmental Impact
As part of Reynolds’ sustainability program, the Green Team calculated the environmental impact created by the organization across several categories: waste sent to the landfill, energy consumption, water use, and carbon dioxide (CO2) emissions. Each category is described below, including current levels and goals.
Waste Sent to the Landfill
Measured in terms of tons of waste sent to the landfill. Through the first three quarters of 2015, Reynolds has sent roughly 65.5 tons of waste to the landfill. Reynolds plans to reduce this amount 90% by the end of 2016 by increasing the recycling rate of the largest sources of this waste, including pallets, packing paper, shrink wrap and contaminated cardboard.
Energy Consumption
Across five facilities, Reynolds consumed 84,885 kWh of electricity and 9,940 therms of natural gas through the first three quarters of 2015. This marks roughly a 11% reduction in electricity usage and a 12% reduction in natural gas use compared to the previous 12 months.
Water Use
Reynolds used roughly 53,400 gallons of water between three facilities through the first three quarters of 2015. This is roughly 2,400 gallons lower because Reynolds uses captured rainwater to wash trucks and water plants.
Internal Carbon Dioxide Emissions
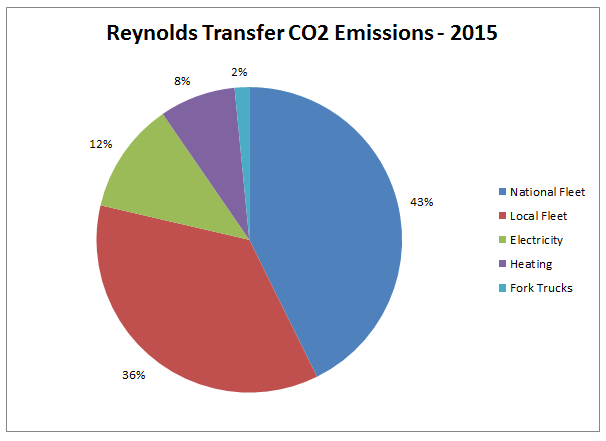
Reynolds’ internal CO2 emissions result from the daily operation of equipment and buildings, including fork trucks, semis, endgate trucks, straight trucks, small fleet vehicles, office space, and warehouse space. In the three quarters ending September 2015, Reynolds created roughly 1,453,200 pounds of CO2 emissions. The chart below shows a breakdown by source. Reynolds plans to reduce these emissions by 5% by the end of 2016 by installing two solar arrays and upgrading old fleet equipment.


